beta_3_real_func
Examples
beta_3_real_func(0)
#> [1] -0.043
beta_3_real_func(10)
#> [1] 0.1036667
beta_3_real_func(10:90)
#> [1] 0.103666667 0.114666667 0.125000000 0.134666667 0.143666667
#> [6] 0.152000000 0.159666667 0.166666667 0.173000000 0.178666667
#> [11] 0.183666667 0.188000000 0.191666667 0.194666667 0.197000000
#> [16] 0.198666667 0.199666667 0.200000000 0.199666667 0.198666667
#> [21] 0.197000000 0.194666667 0.191666667 0.188000000 0.183666667
#> [26] 0.178666667 0.173000000 0.166666667 0.159666667 0.152000000
#> [31] 0.143666667 0.134666667 0.125000000 0.114666667 0.103666667
#> [36] 0.092000000 0.079666667 0.066666667 0.053000000 0.038666667
#> [41] 0.023666667 0.008000000 -0.008333333 -0.025333333 -0.043000000
#> [46] -0.061333333 -0.080333333 -0.100000000 -0.120333333 -0.141333333
#> [51] -0.163000000 -0.185333333 -0.208333333 -0.232000000 -0.256333333
#> [56] -0.281333333 -0.307000000 -0.333333333 -0.360333333 -0.388000000
#> [61] -0.416333333 -0.445333333 -0.475000000 -0.505333333 -0.536333333
#> [66] -0.568000000 -0.600333333 -0.633333333 -0.667000000 -0.701333333
#> [71] -0.736333333 -0.772000000 -0.808333333 -0.845333333 -0.883000000
#> [76] -0.921333333 -0.960333333 -1.000000000 -1.040333333 -1.081333333
#> [81] -1.123000000
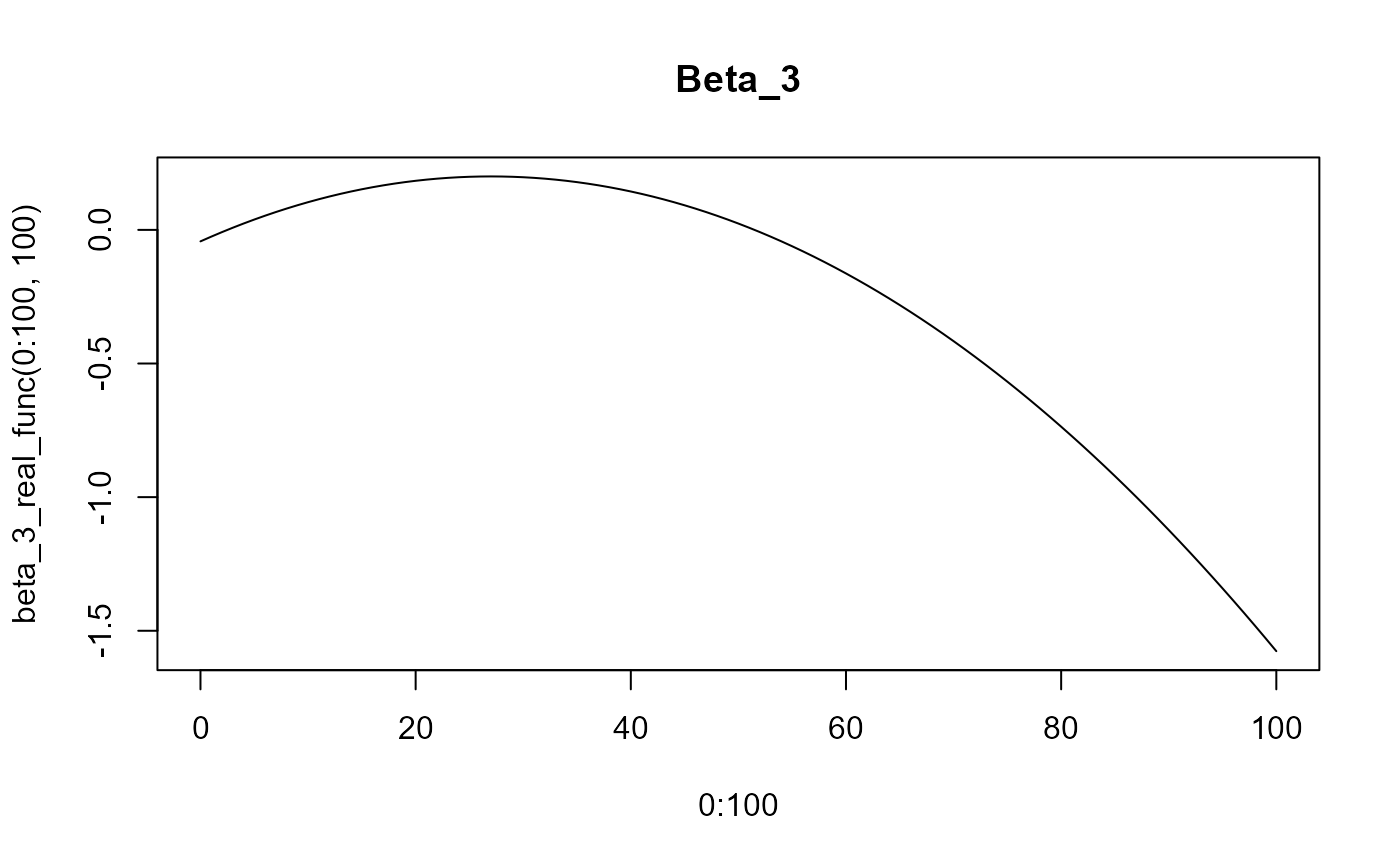
plot(x=0:100, y=beta_3_real_func(0:100, 100), type='l', main="Beta_3")