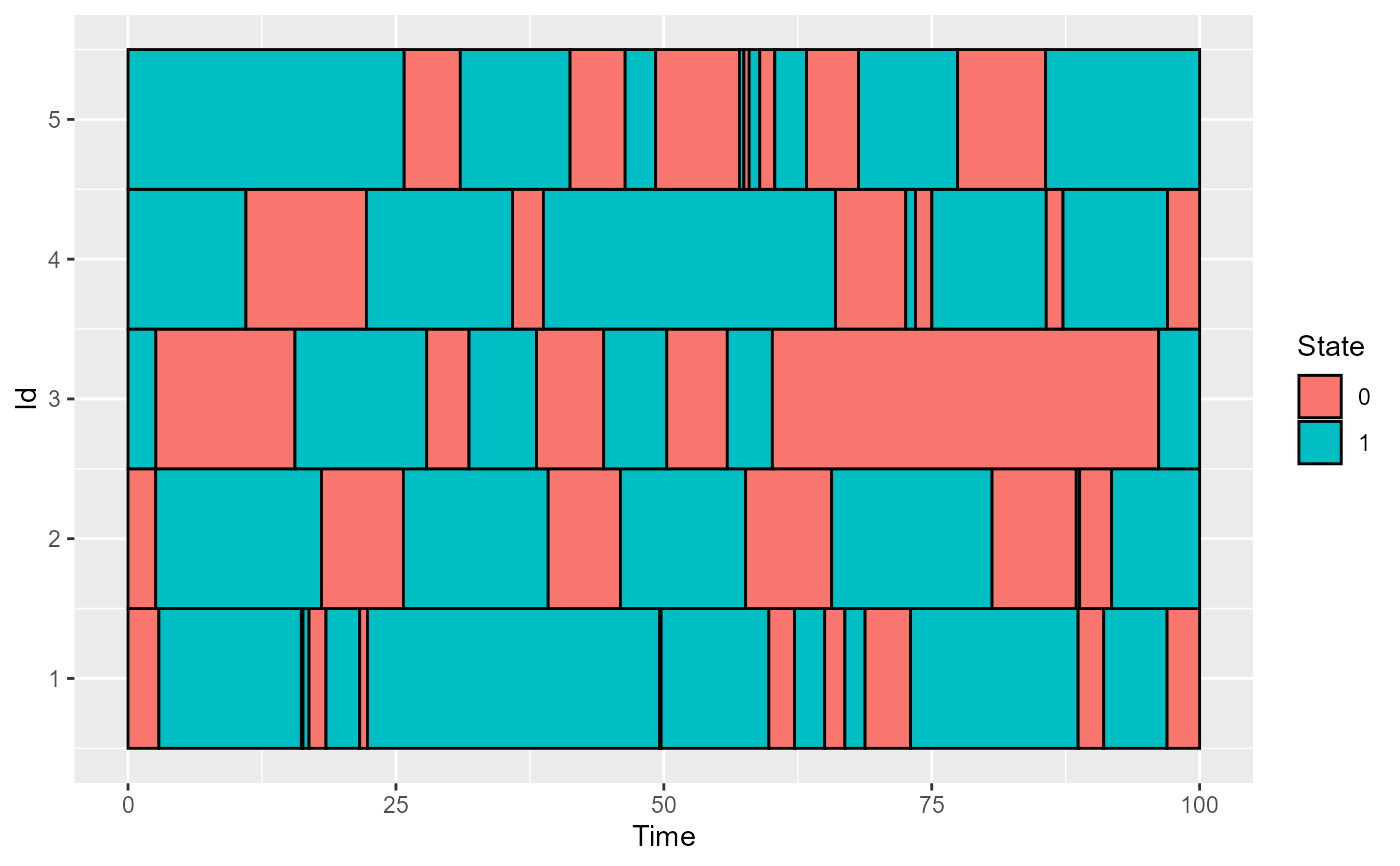
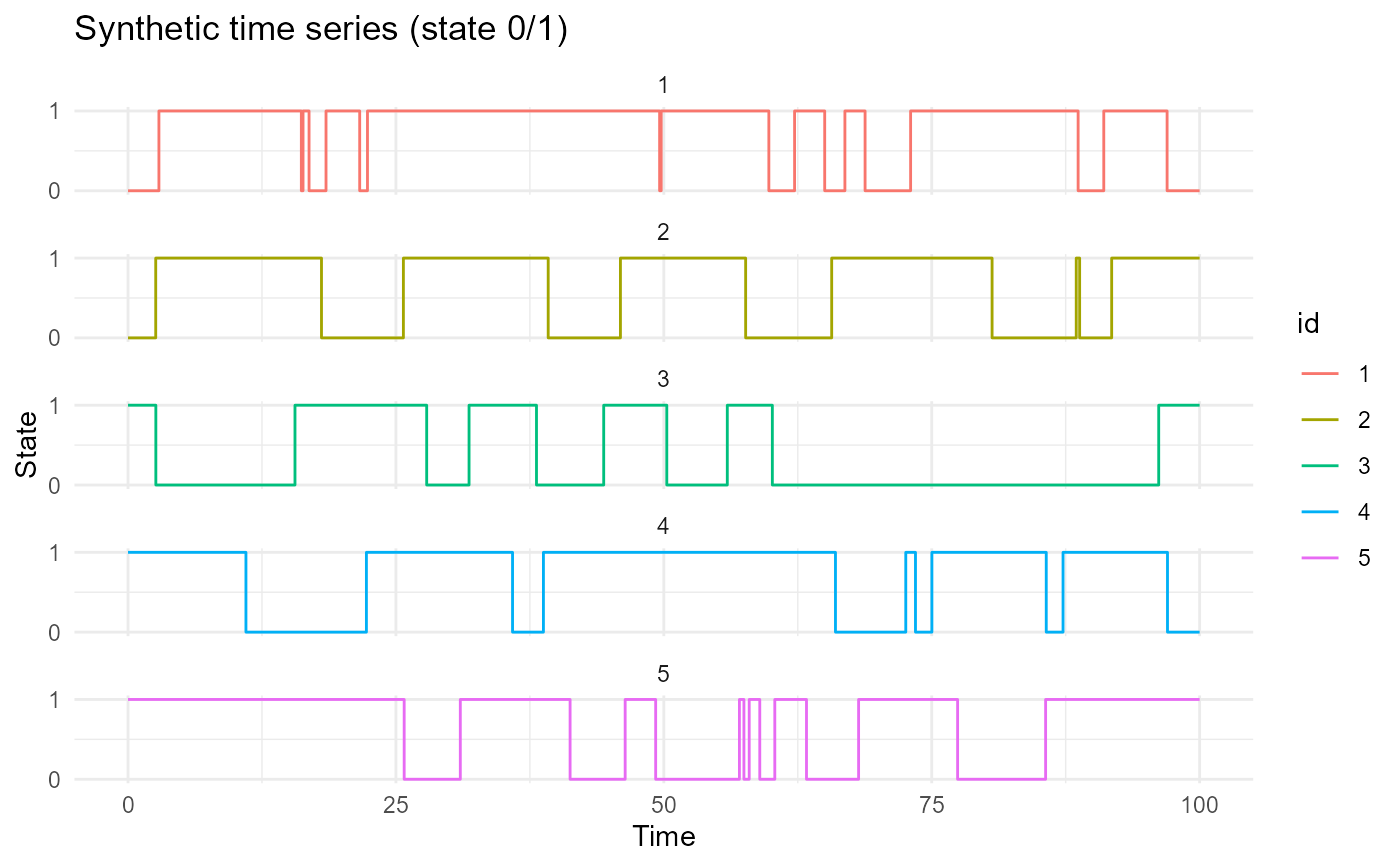
This function only plot some individuals. It plots the first plot_individuals of df_to_plot. Works both for single state and multistates data (numerical states 1, 2, 3, etc)
Usage
plot_CFD_individuals(
  df_to_plot,
  n_ind_to_plot = 5,
  id_col = "id",
  time_col = "time",
  by_cfda = FALSE
)
Arguments
- df_to_plot
dataframe whose individuals will be plotted
- n_ind_to_plot
number of the first individuals to plot, default 5
- id_col
col_name of df_to_plot for the id, not character, default id'
- time_col
col_name of df_to_plot for the time, not character, default 'time'
- by_cfda
a boolean to use cfda package function plotData, default FALSE
Examples
df = generate_X_df()
plot_CFD_individuals(df, 5)

plot_CFD_individuals(df, 5, by_cfda = TRUE)